Samsung Health: Swimming Statistic, Calendar and Your Progress Data
I would like to describe which data about my swimming exercises Samsung Health collects and provides to me. By the way, similar level of details is provided for other sport activities, but here I focus on swimming.
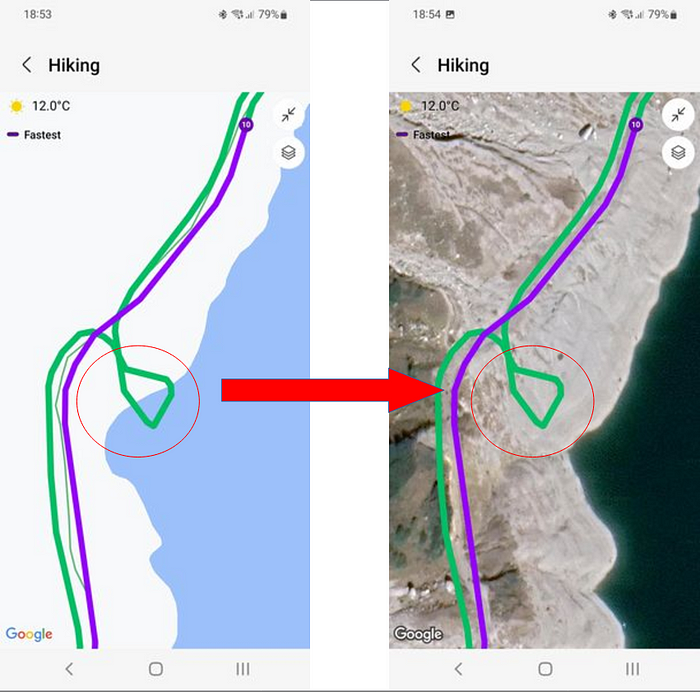
Note: I also use my galaxy watch for other sport activities, like hiking and for gym.
First things first, for each individual swimming training one gets a lot of data which includes:
Duration, distance, average speed, heart rate (timeline and zones), calories, number of stoke, number of lengths, SWOLF and so on.
Check screenshot below to see the full data included in the summary.
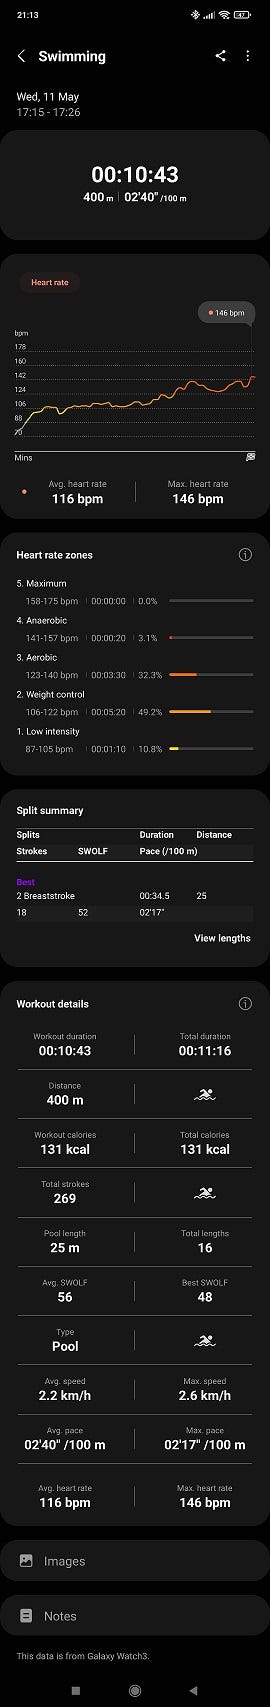
I’m not a pro swimmer, therefore I personally check:
Duration, distance, number of lengths, average and maximum speed.
This was a summary. You can see details for every “length”. To do this, you should tap on “view lengths” block.
“Lengths” looks the following way:
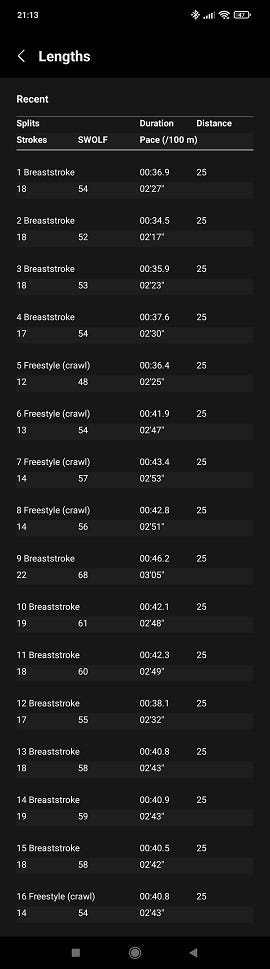
Here, interesting parameters for me are: how speed changes during the training, styles I swam, which style is faster, number of strokes.
The only information I miss for an individual training is — distance I swam for every style separately.
Next useful view is a calendar with filtering by sport type — you can easily see when and how much you have trained. Days when you had activity are marked with green circles (size of a circle indicates activity time).
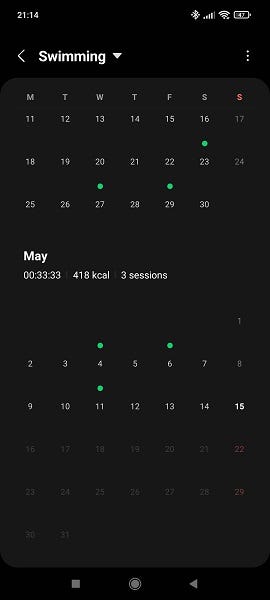
I use this view to check how regular I exercise. I also used this view to find some special hikes I did. By the way, you can hide autodetected activities, to see only explicitly recorded training.
And this is not all still.
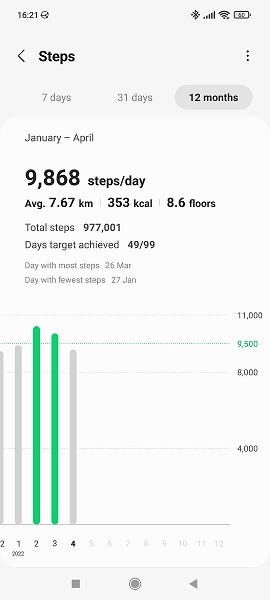
Last but not least, Samsung Health has a “trend” view (which can also be filtered by sport type and manual/autodetected training).
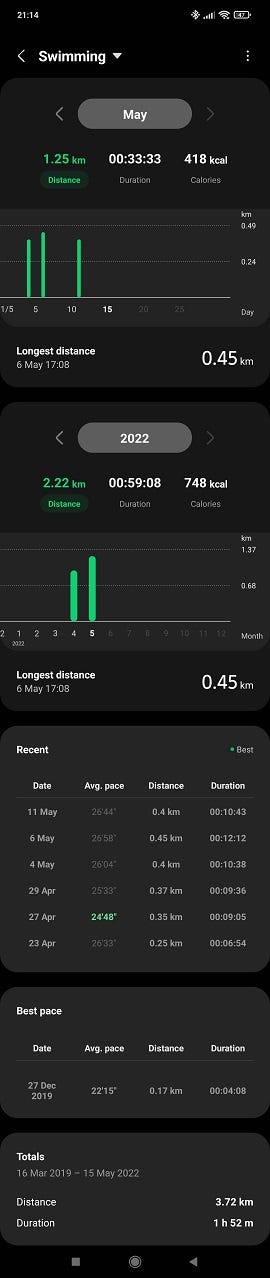
On this screen, you can compare different sessions on the timeline visually. In a small (days) and a big (months) scales. For swimming — you can compare based on distance, duration or calories.
The next section shows you the list of recent sessions, where the best result is highlighted (average pace for swimming) — very handy to check the progress.
The last section is my favorite — “Totals”. It shows the total distance I swam — just 3.72km so far (my total hiking and walking numbers are “better” : hiking — 359 km, walking — 3879 km).
If data presentation I described above is not what you need… you can extract raw data in JSON and CSV files and represent it in a way you need.
Have a nice swimming!