Garmin Venu3 vs Galaxy Watch: Health Features Comparison
I have been using my Garmin Venu 3 already for a few weeks, and now I can start comparing it with the Galaxy Watch in the health department.
First, what I noticed is the fundamentally different approaches Garmin and Samsung have.
When I use Samsung Health I have to guess how this or that feature works and how to use it. For example, how is stress calculated, and how do you use the result (which, by the way, has no numerical value)? I did not find an explanation provided by Samsung.
Even the definition of animals that the Samsung Health Sleep Coach assigns to you is not clearly explained (if you are interested – you can find them here).
Garmin is different – on its site, there are pages about different metrics, how they are collected and calculated, and how one can act on them.
Generally, I have a feeling that Samsung makes features to have a feature (for an example check “Two Galaxy Watch Features Samsung Should Not Have Been Implementing“), while Garmin makes features for a purpose with a real usage scenario in mind.
But this was a generic impression. Let me jump in some details.
Sleep Tracking
Both, the Venu 3 and the Galaxy Watch are not very great catching time when I fail to sleep during the night. It looks like I’m too quiet and too movementless. As a result, I believe both overestimate my sleep quality.
However, till now, my Venu 3 was consistent in sleep quality assessment – the assessments always matched the measured data. Meanwhile, Samsung Health sometimes marked 4 hours of sleep as good quality sleep.
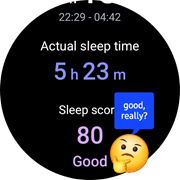
Initially, I thought that this meant how good this sleep session was as such, independent on the duration – like if I took the maximum from these few hours I could. But other examples showed that duration is actually considered by the Samsung algorithm. I do not know how I should understand the sleep quality the Galaxy Watch provides me. Samsung does not provide any useful details either, but I already wrote about this above.
Another difference – in the Garmin Connect, you can see a graph that combines sleep quality with other metrics. This way, you can find dependencies and correlations.
Just two screenshots to illustrate the difference:
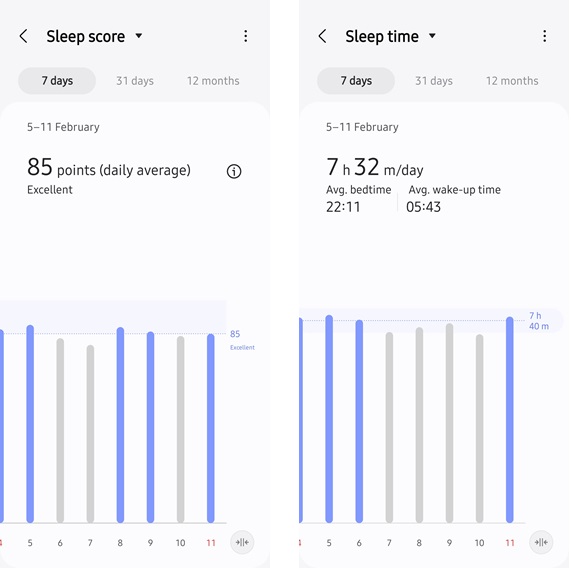
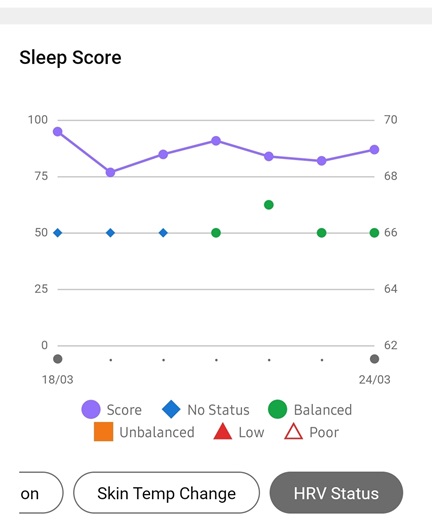
By the way, none of the watches can show me a graph of real sleep time history. Why?
Hearth Rate (aka HR) monitoring
Both watches measure HR and according to many tests, Venu3 does this much more accurately. I did not do any tests. Still, during my gym sessions and walks, it was not unusual for my Galaxy Watch to not be able to read my HR (gray heart icon). So far, I have never noticed this using my Venu. Probably 1 LED versus 4 LED sensors?
But the main difference is representation: Samsung Health shows a min/max bar diagram per hour. I found it useless. Once I felt not very well and wanted to check my HR during the night and the previous day – I found no way to read these bars without even knowing what I did that time.
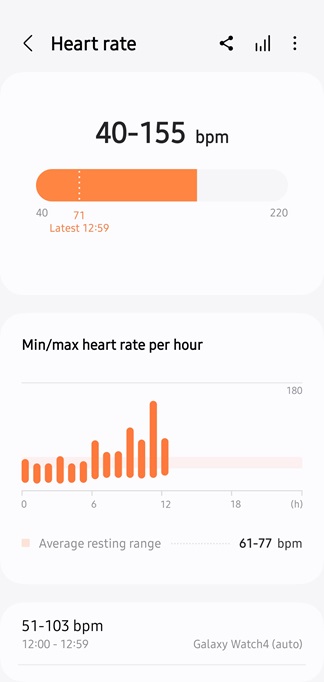
Garmin shows a real graph and indicates when I was sleeping and exercising; this information I can understand and interpret.
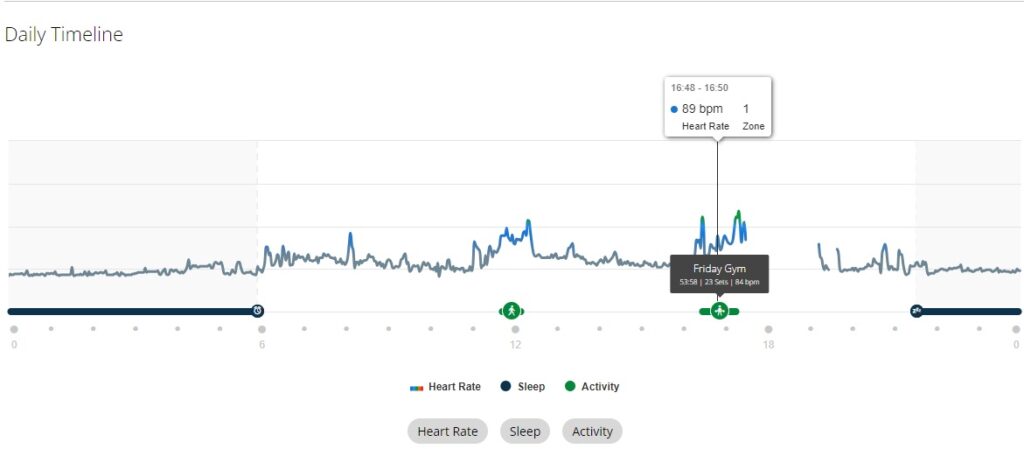
This said, the HRV and Stress are better sickness indicators offered by Venu (see below).
Resting HR
Resting HR (RHR) is an important health indicator, which is often correlated with mortality and other issues. I have worte about RHR in the “What Useful Health Information a Regular Person Can Learn using a Galaxy Watch?” article (it is not about RHR only). And here, I think Samsung Health has a better implementation.
First aspect is the measurement as such:
According to Wikipedia RHR is “defined as the heart rate when a person is awake, in a neutrally temperate environment, and has not been subject to any recent exertion or stimulation, such as stress or surprise.”
Did you notice “awake” in the quote above? This is when my Galaxy Watch “recorded” my RHR. Wikipedia says nothing about how one should aggregate measured values during the day. It looks like Samsung Health takes the lowest value, which is rather questionable, but not that bad either.
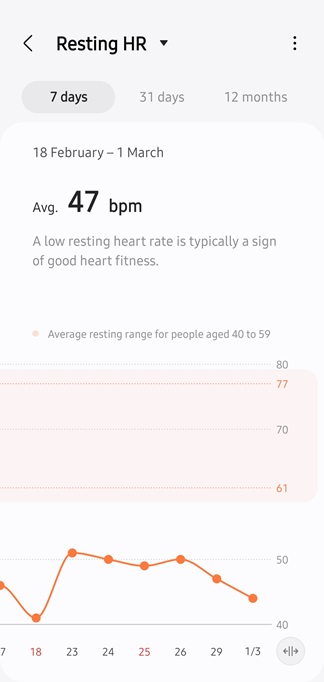
On the other hand, Garmin explicitly explains how it measures RHR in this article and according to this description and many reports, it takes your sleep HR to calculate RHR and does some averaging (“ the lowest 30 minute average in a 24 hour period”). This means that the value you get from Garmin is lower than the value you get from the Galaxy Watch, and this value does not match the Wikipedia RHR definition. Strange.
The second part is representation.
Samsung Health can show you a graph of RHR (but, many people still do not know where to find it), while Garmin Connect shows it together with Max HR history only. This makes RHR changes hardly visible.
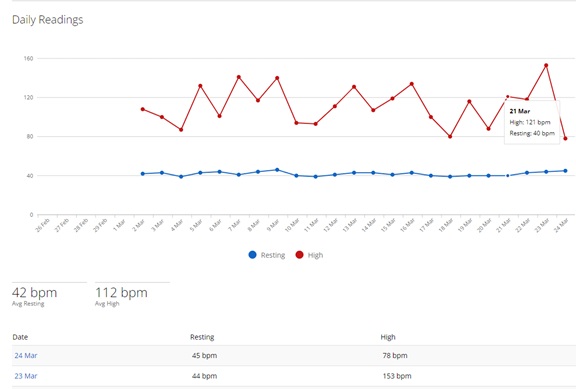
As I already said, I personally prefer Samsung’s implementation.
Stress
Here it is simple: the Garmin Venu 3 is much better.
- It gives me a number, which I can use for comparison.
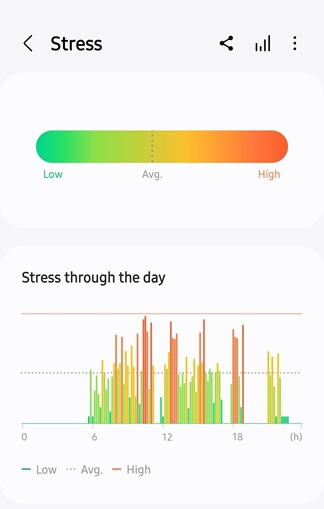
- It tells me how much time during the day I had this or that level of stress.
- It shows me a graph where it indicates activities and other events. It also distinguishes activity and just “not measured” as well.
- Moreover, Garmin provides me with an interpretation!
Galaxy Watch (Samsung Health, actually) does not do any of that.
On top of that, there are two more big differences:
The major difference #1:
Garmin measures stress during sleep. The Galaxy Watch does not. Stress (and the HRV) during the night is the first thing I would check if I do not feel well in the morning. It is basically the best indication of how your body felt that night.
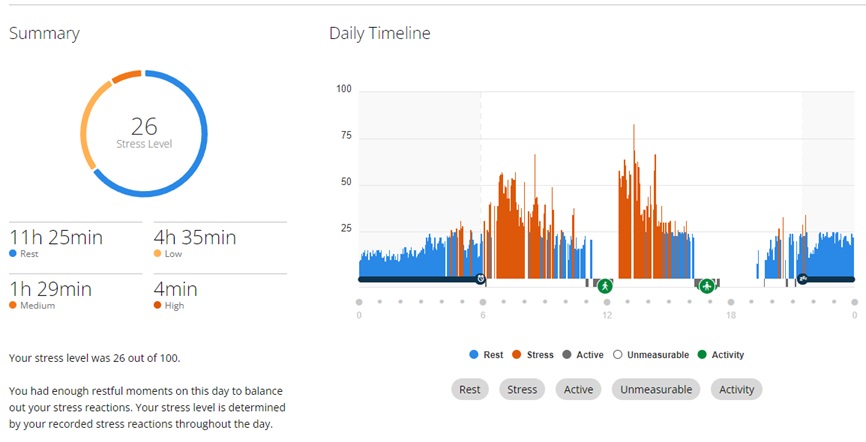
Stress during sleep shows how alcohol impacts your body and your sleep quality. I saw a lot of posts from people who discovered how much they underestimated alcohol’s impact on their bodies via this feature and reduced alcohol consumption. I cannot comment personally here – I have stopped alcohol consumption before I had my Garmin.
The major difference #2:
My Venu 3 can notify me when my stress is high for some time during the day. This is exactly what I expect from a body monitoring device: if something is wrong or unusual – inform me. And this is exactly what the Galaxy Watch does not do (and I do not understand why).
Heart Rate Variability (aka HRV)
HRV – the main parameter behind stress estimation. For whatever reason, the Galaxy Watch does not show it at all. Garmin Venu 3, on the other hand, measures it during the night, and shows the number.
Moreover, there are no universal good/bad values for everyone. Therefore, Garmin watches need 3 – 4 weeks to understand your baseline and then let you know if your HRV starts to move away from them. The Garmin YouTube channel has a few videos where they explain what HRV is and what it means.
Big, not BIG, respect Garmin for this solid approach!
Respiration Rate
My Venu 3 can estimate my respiration rate. The Galaxy Watch cannot. End of comparison.
VO2 Max
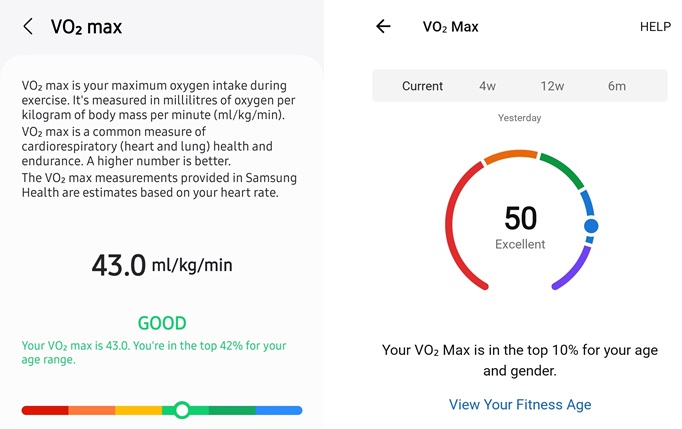
Both watches can estimate VO2 Max (a very important health indicator, if you did not know). Samsung Health hides it inside exercise statistics (read here where to find it). Garmin shows it as a “performance” metric. Here, I agree with Garmin. Moreover, according to Garmin, I have a higher VO2 Max – I like that!
Body battery
You cannot describe a Garmin watch and do not mention a body battery. This is a Garmin proprietary feature. The idea is – the watch uses all your activities, including rest, sleep, stress, exercises, naps, etc., and calculates how full of energy your body is
.Samsung announced something similar to be added to Samsung Health. But currently, it does not offer anything. I, personally, do not expect that Samsung will invest enough effort to introduce and build a high-quality solution here. Moreover, this is a synthetic metric – it needs good-quality input, which Galaxy Watch sensors cannot deliver so far.
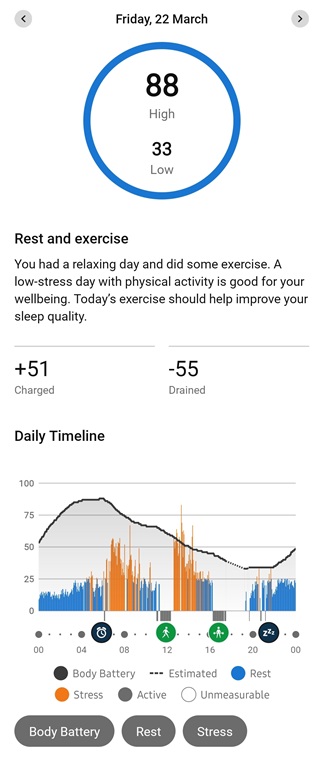
The Garmin Body battery is not ideal, and for some people, its results are off. But for me, it looks rather relevant. And I like it.
Other features
There are other health-related features that one or another (or both) watches have: ECG, Blood Pressure, Body Composition, Fitness Age, meditation and breath exercises, and irregular HR monitoring. I did not include them in this article, either because I do not use them at all, or because I have not used them enough yet.
Conclusion
In this article, I have compared the most important (for me) health features of both watches. Still, many details are, unfortunately, left behind the scenes. But, even without digging into these nuances, one can see the significant difference between the approaches these two companies use.
And since health (and exercise) features are more important for me than the ability to write a new WhatsApp message or control the light in the room directly from my watch (see my reflection about smart features) – I am really happy with the switch I did.
PS
If you are considering to purchase a Garmin Venu 3 (or even Fenix 8 🙂 ) or a Galaxy Watch 7, consider to use my partner links below – costs nothing extra for you, but can help me to pay for the hosting. Thank you in advance!




RHR – personally I think garmin doing a sleeping RHR is better as it provides more consistent data than RHR done during the day; and as this feeds into other metrics like additional calorie burn I prefer that much more consistent baseline than an awake one would provide (especially considering these are automated and thus are not necessarily all done at the same time – if doing an awake RHR ideally it needs to be done consistently first thing in the morning before you get out of bed and become activie – but watches do not automatically do this and thus work on approx 30min lowest period during the day – thus no consistency.
RHR Graph – not an option in the app – but if you use the web you can get this metric by itself- using the left sidebar menu – Reports – health & fitness – RHR. {There are quite a few features that are web only}
Real Sleep time history graph – not sure if you have missed this on Garmin, or its not giving you what you need. On the app open your sleep score widget – at the top press the data period you want to view i.e. 7d, 4w or 1y. (you can then press the arrow below this where it shows the date period to show different periods of the select period), scroll past the sleep score period as there are other tables under it – you get a sleep duration vs sleep need graph – isn’t that your sleep time history graph? Or if you were referring to start time you have the sleep consistency graph below it which shows start and wake times. Does that cover your requirements……